반응형
프로메테우스 구성 가이드 : https://prometheus.io/docs/prometheus/latest/configuration/configuration/#static_config
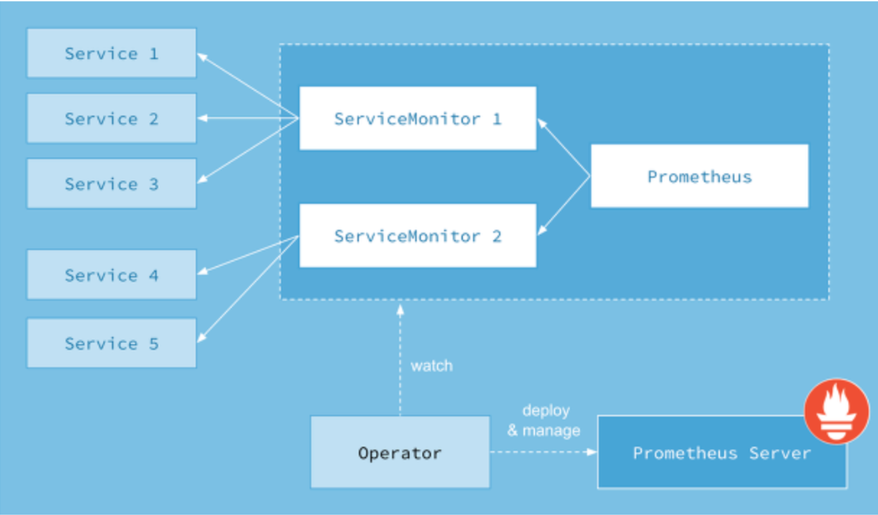
프로메테우스 구성도

1. Prometheus Component
Prometheues Operator
- Prometheus Server와 Alertmanager 등을 관리
Prometheues Server
- ServiceMonitor 정의된 Target 메트릭 정보를 수집
- ServiceMonitor, PodMonitor가 있다.
- AlertManager가 설정된 내용으로 Alert 전송
Prometheues metrics
- kubernetes metrics-server의 메트릭 정보를 수집
Prometheues node exporter
- node exporter 정보 : https://github.com/prometheus/node_exporter
- 워커노드 메트릭을 수집하기 위한 Agent 역할
- 워커노드에는 kubelet이 설치되어 있고, kubelete의 cAdvisor를 통해서 컨테이너 메트릭 정보를 수집할 수 있다.
Prometheues Alertmanager
- Alert 관련 설정
- Alert 대상
- Slack, Mail 전달할 플랫폼 설정
Prometheues grafana
2. Prometheus 리소스
ServiceMonitor
- 프로메테우스 서버는 ServiceMonitor에 설정한 TAGET 정보의 메트릭을 수집한다.
- 메트릭 정보를 수정해도 프로메테우스 서버를 리스타트 할 필요없이, ServiceMonitor를 참조해서 가져온다.
- endpoints 옵션은 메트릭 수집할 port 이름을 지정한다.
- selector 옵션은 메트릭 수집할 서비스 라벨링을 지정한다.
apiVersion: monitoring.coreos.com/v1
kind: ServiceMonitor
metadata:
  name: prometheus-prometheus-node-exporter
  namespace: monitor
  labels:
    jobLabel: node-exporter
    release: prometheus
spec:
  jobLabel: jobLabel
  selector:
    matchLabels:
      app.kubernetes.io/instance: prometheus
      app.kubernetes.io/name: prometheus-node-exporter
  endpoints:
    - port: http-metrics
      scheme: http
- ServiceMonitor 정보 확인
- kubectl get servicemonitors.monitoring.coreos.com
- 프로메테우스 오브젝트 정보 확인
- kubectl describe prometheus
반응형
'모니터링 > prometheus' 카테고리의 다른 글
| [ Prometheus ] exporter 종류 (0) | 2023.03.16 |
|---|---|
| [ Prometheus ] Nginx Log exporter (0) | 2023.03.16 |
| [ prometheus ] Nginx exporter (0) | 2023.03.16 |
| [ prometheus ] node exporter (0) | 2023.02.23 |
| [ prometheus ] 설치 (0) | 2023.02.23 |