프로메테우스는 메트릭 정보만 가져올 수 있다.
kubernetes의 pod 로그를 가져오려면 로그 수집 Loki를 이용해야한다.
1. Loki 이란?
Grafana Loki(그라파나 로키)는 분산 로그 수집 시스템으로, Prometheus와 함께 Grafana Labs에서 개발한 오픈소스 프로젝트입니다.
Loki는 로그 데이터를 수집하고 색인화하여 검색 가능한 형식으로 저장하는 기능을 제공합니다. 이를 통해 대규모 분산 시스템에서 발생하는 로그 데이터를 보다 쉽게 관리하고 분석할 수 있습니다. Loki는 기존의 로그 수집 시스템과 달리, 로그 데이터를 중앙 집중화 하지 않고 각 서버에서 직접 수집하여 저장합니다. 이는 저장 공간과 네트워크 대역폭을 절약할 수 있으며, 더욱 확장 가능하고 유연한 로그 수집 시스템을 구축할 수 있도록 합니다.
또한 Grafana Loki는 Prometheus와 함께 사용할 수 있으며, Prometheus와 같은 쿼리 언어를 사용하여 로그 데이터를 검색하고 시각화할 수 있습니다. 이를 통해 시스템의 문제점을 신속하게 파악하고 대응할 수 있으며, 시스템 운영자와 개발자들에게 많은 가치를 제공합니다.
[ Loki 기능 ]
- promtail을 통한 로그 수집
- Service Discovery 사용 가능
- Loki에 로그 저장, 인덱스 구조
- LogQL 명령어로 조회 가능
- Grafana 연동 가능
- 로그 기반 Alert
- AlertManager를 통해서 알람 발송
[ Loki 아키텍처 ]

- Loki 로그 저장소
- Promtail가 Node 로그를 수집
- Grafana에서 Loki 로그 저장소를 읽어서 시각화
2. Loki 설치
- Loki : 로그 저장소
- loki helm repository 정보
helm repo add loki https://grafana.github.io/loki/charts

helm repo update
helm repo list
- loki 설치
- source 파일 : https://github.com/tingtomkim/devops/tree/main/monitoring/loki
- Ingress + PVC 설정 정보 포함
helm upgrade --install loki . -f values-service-prod.yaml --namespace monitor
- Ingress 설정 정보
ingress:
  enabled: true
  annotations:
    alb.ingress.kubernetes.io/actions.ssl-redirect: '{"Type": "redirect", "RedirectConfig":
      { "Protocol": "HTTPS", "Port": "443", "StatusCode": "HTTP_301"}}'
    alb.ingress.kubernetes.io/certificate-arn: arn:aws:acm:ap-southeast-1:xxx:certificate/xxx-xxx
    alb.ingress.kubernetes.io/group.name: infra-alb-internal
    alb.ingress.kubernetes.io/listen-ports: '[{"HTTP": 80}, {"HTTPS":443}]'
    alb.ingress.kubernetes.io/load-balancer-name: infra-alb-internal
    alb.ingress.kubernetes.io/scheme: internal
    alb.ingress.kubernetes.io/ssl-redirect: "443"
    alb.ingress.kubernetes.io/target-type: ip
    alb.ingress.kubernetes.io/ssl-policy: ELBSecurityPolicy-FS-1-2-Res-2020-10
    kubernetes.io/ingress.class: alb
  hosts:
    - host: loki.test.com
      paths:
        - path: /*
  tls: []
  #  - secretName: chart-example-tls
  #    hosts:
  #      - chart-example.local
- PVC 설정 정보
valuepersistence:
  enabled: true
  accessModes:
  - ReadWriteOnce
  size: 50Gi
- S3 설정 정보
- chunk_idle_period : 하나의 chunk(로그 덩어리)에 새로운 로그가 3분간 들어오지 않으면, 해당 chunk는 idle 상태로 간주되고 flush(디스크 또는 object storage로 저장)됩니다.
- shutdown_marker_path : 인제스터 종료 시 해당 경로에 marker 파일을 생성해서 /ingester/prepare_shutdown 요청이 가능하게 만듭니다.( Loki 종료 시 안전하게 chunk를 flush할 수 있게 해줌.)
- store: boltdb-shipper : boltdb-shipper 방식으로 인덱스 + 청크로 로그를 관리함
- object_store : s3에 로그를 업로드함 (chunk 로그)
- shared_storage : S3에 인덱스를 업로드함 (index 인덱스)
boltdb-shipper는 인덱스를 로컬 디스크에 저장 후 S3에 업로드해야합니다.
S3에 인덱스를 실시간으로 저장할 수 없습니다.
PVC 10GB설정은 인덱스 디렉토리 전용 스토리지 입니다.
pod가 강제 종료되었을 때 데이터 유실을 방지하는 목적으로 최소한 설정
config:
  ingester:
    chunk_idle_period: 3m
    shutdown_marker_path: /data/loki/shutdown-marker


  schema_config:
    configs:
    - from: 2020-10-24
      store: boltdb-shipper
      #object_store: filesystem
      object_store: s3     # modify


  storage_config:
    boltdb_shipper:
      active_index_directory: /data/loki/boltdb-shipper-active
      cache_location: /data/loki/boltdb-shipper-cache
      cache_ttl: 24h         # Can be increased for faster performance over longer query periods, uses more disk space
      shared_store: s3
    filesystem:
      directory: /data/loki/chunks
    aws:
      s3: s3://ap-northeast-2/xxxxxx버킷 이름

  compactor:
    working_directory: /data/loki/boltdb-shipper-compactor
    #shared_store: filesystem
    shared_store: s3     # modify

  table_manager:
    retention_deletes_enabled: true
    retention_period: 168h  # S3에 데이터 7day 보관


persistence:
  enabled: true
  #enabled: false
  accessModes:
  - ReadWriteOnce
  size: 10Gi
  storageClassName: gp3


serviceAccount:
  create: true
  name:
  #annotations: {}
  annotations:
    eks.amazonaws.com/role-arn: arn:aws:iam::xxxx:role/dev-monitor-role
3. promtail 설치
- Promtail : 로그 수집기
- Promtail 설치
- source 파일 : https://github.com/tingtomkim/devops/tree/main/monitoring/promtail
helm upgrade --install promtail . -f values-service-prod.yaml --namespace monitor
4. Grafana에서 Loki 등록하기
- Loki Datasource 등록하기
- Configuration → “Data sources” → “Add data source” 클릭
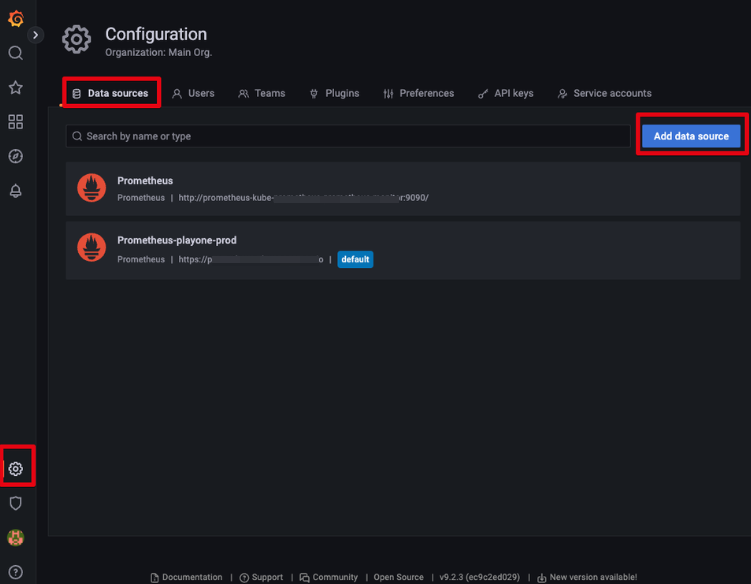
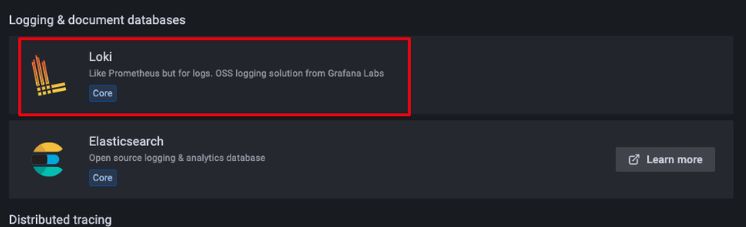
- Loki 찾아서 클릭
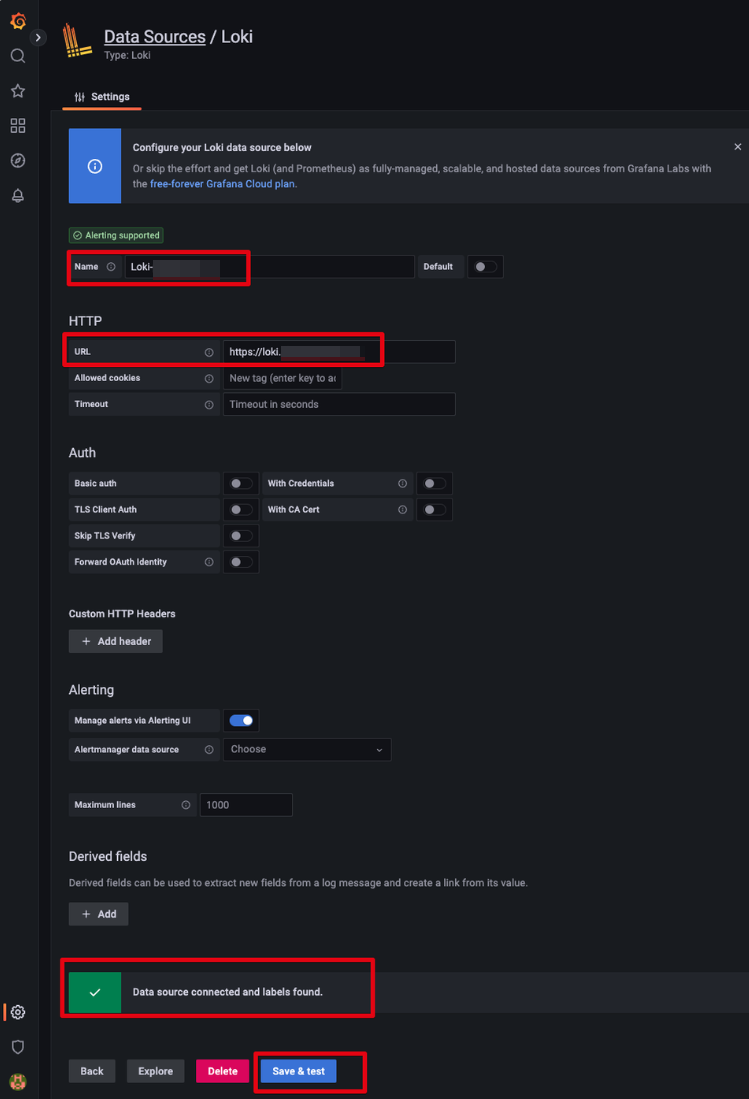
- Loki 내용 입력
- Name : Loki-playone-prod
- URL : Loki Ingress 주소 입력
- “Save & test” 클릭
- 연결 접속 성공 확인
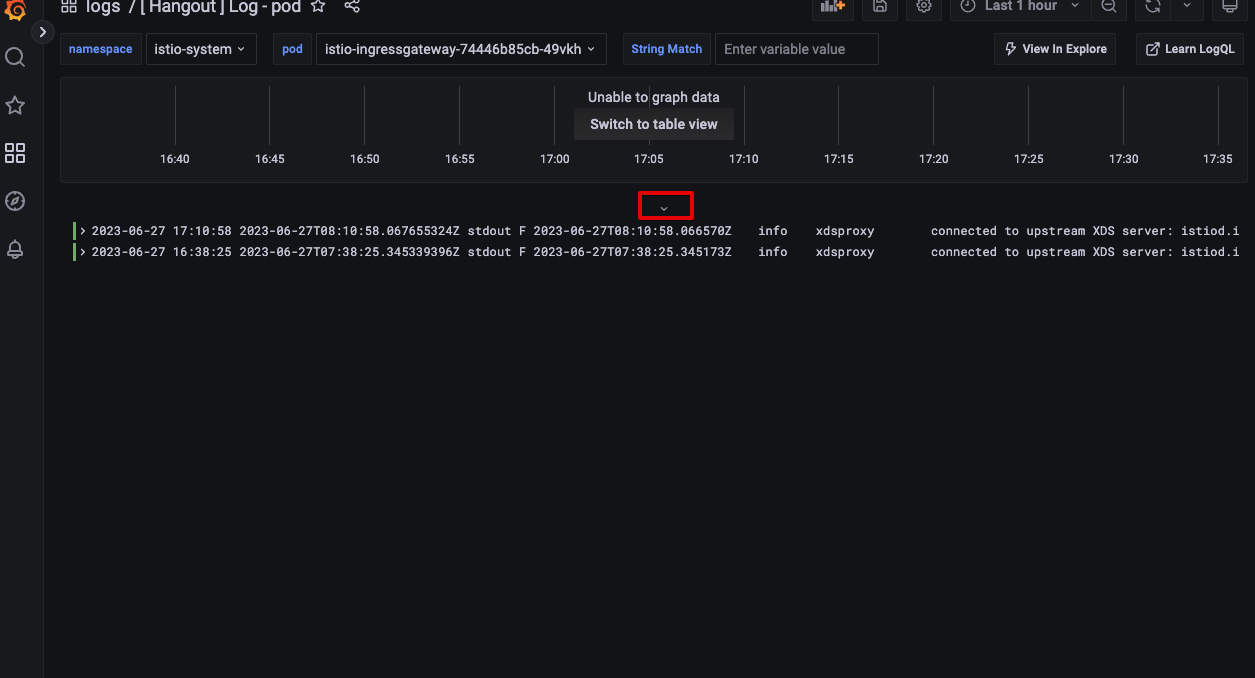
5. Loki Dashboard 생성하기
Loki에서 수집한 로그를 볼 수 있는 데쉬보드 생성하기입니다.
- Dashboard -> New -> "New Floder" 클릭
- LOG 폴더 생성
- Dashboard -> New -> "import" 클릭

- Import : 13639 (pod 단위 log보는 데쉬보드)
- Import : 12019 (Namespace 단위 log보는 데쉬보드)

- Name : Dashboard Name 입력
- Folder : Log 폴더 선택
- UID : Dashboard UID 구분 용도
- Loki : 등록한 Loki 클릭
- import 클릭

- Log 데쉬보드 생성 확인

----------------------------
Custom import
log - pod
{
  "annotations": {
    "list": [
      {
        "$$hashKey": "object:75",
        "builtIn": 1,
        "datasource": {
          "type": "datasource",
          "uid": "grafana"
        },
        "enable": true,
        "hide": true,
        "iconColor": "rgba(0, 211, 255, 1)",
        "name": "Annotations & Alerts",
        "target": {
          "limit": 100,
          "matchAny": false,
          "tags": [],
          "type": "dashboard"
        },
        "type": "dashboard"
      }
    ]
  },
  "description": "Log Viewer Dashboard for Loki",
  "editable": true,
  "fiscalYearStartMonth": 0,
  "gnetId": 13639,
  "graphTooltip": 0,
  "id": 32,
  "links": [
    {
      "$$hashKey": "object:59",
      "icon": "bolt",
      "includeVars": true,
      "keepTime": true,
      "tags": [],
      "targetBlank": true,
      "title": "View In Explore",
      "type": "link",
      "url": "/explore?orgId=1&left=[\"now-1h\",\"now\",\"Loki\",{\"expr\":\"{job=\\\"$app\\\"}\"},{\"ui\":[true,true,true,\"none\"]}]"
    },
    {
      "$$hashKey": "object:61",
      "icon": "external link",
      "tags": [],
      "targetBlank": true,
      "title": "Learn LogQL",
      "type": "link",
      "url": "https://grafana.com/docs/loki/latest/logql/"
    }
  ],
  "liveNow": false,
  "panels": [
    {
      "aliasColors": {},
      "bars": true,
      "dashLength": 10,
      "dashes": false,
      "datasource": {
        "type": "loki",
        "uid": "3Uz3HcX4z"
      },
      "fieldConfig": {
        "defaults": {
          "links": []
        },
        "overrides": []
      },
      "fill": 1,
      "fillGradient": 0,
      "gridPos": {
        "h": 3,
        "w": 24,
        "x": 0,
        "y": 0
      },
      "hiddenSeries": false,
      "id": 6,
      "legend": {
        "avg": false,
        "current": false,
        "max": false,
        "min": false,
        "show": false,
        "total": false,
        "values": false
      },
      "lines": false,
      "linewidth": 1,
      "nullPointMode": "null",
      "options": {
        "alertThreshold": true
      },
      "percentage": false,
      "pluginVersion": "9.2.3",
      "pointradius": 2,
      "points": false,
      "renderer": "flot",
      "seriesOverrides": [],
      "spaceLength": 10,
      "stack": false,
      "steppedLine": false,
      "targets": [
        {
          "datasource": {
            "type": "loki",
            "uid": "3Uz3HcX4z"
          },
          "editorMode": "code",
          "expr": "sum(count_over_time({pod=\"$pod\", namespace=\"$namespace\"} |= `$search` [$__interval]))",
          "legendFormat": "",
          "queryType": "range",
          "refId": "A"
        }
      ],
      "thresholds": [],
      "timeRegions": [],
      "tooltip": {
        "shared": true,
        "sort": 0,
        "value_type": "individual"
      },
      "type": "graph",
      "xaxis": {
        "mode": "time",
        "show": true,
        "values": []
      },
      "yaxes": [
        {
          "$$hashKey": "object:168",
          "format": "short",
          "logBase": 1,
          "show": false
        },
        {
          "$$hashKey": "object:169",
          "format": "short",
          "logBase": 1,
          "show": false
        }
      ],
      "yaxis": {
        "align": false
      }
    },
    {
      "datasource": {
        "type": "loki",
        "uid": "3Uz3HcX4z"
      },
      "gridPos": {
        "h": 25,
        "w": 24,
        "x": 0,
        "y": 3
      },
      "id": 2,
      "maxDataPoints": "",
      "options": {
        "dedupStrategy": "none",
        "enableLogDetails": true,
        "prettifyLogMessage": false,
        "showCommonLabels": false,
        "showLabels": false,
        "showTime": true,
        "sortOrder": "Descending",
        "wrapLogMessage": false
      },
      "targets": [
        {
          "datasource": {
            "type": "loki",
            "uid": "3Uz3HcX4z"
          },
          "editorMode": "builder",
          "expr": "{namespace=\"$namespace\", pod=\"$pod\"} |= `$search` | logfmt",
          "hide": false,
          "legendFormat": "",
          "queryType": "range",
          "refId": "A"
        }
      ],
      "transparent": true,
      "type": "logs"
    }
  ],
  "refresh": false,
  "schemaVersion": 37,
  "style": "dark",
  "tags": [],
  "templating": {
    "list": [
      {
        "current": {
          "selected": false,
          "text": "default",
          "value": "default"
        },
        "datasource": {
          "type": "prometheus",
          "uid": "prometheus"
        },
        "definition": "label_values(kube_pod_info, namespace)",
        "hide": 0,
        "includeAll": false,
        "multi": false,
        "name": "namespace",
        "options": [],
        "query": {
          "query": "label_values(kube_pod_info, namespace)",
          "refId": "StandardVariableQuery"
        },
        "refresh": 1,
        "regex": "",
        "skipUrlSync": false,
        "sort": 0,
        "type": "query"
      },
      {
        "current": {
          "selected": false,
          "text": "prod-lifex-85947479fc-5v4q7",
          "value": "prod-lifex-85947479fc-5v4q7"
        },
        "datasource": {
          "type": "prometheus",
          "uid": "prometheus"
        },
        "definition": "label_values(kube_pod_info{namespace=\"$namespace\"}, pod)",
        "hide": 0,
        "includeAll": false,
        "label": "",
        "multi": false,
        "name": "pod",
        "options": [],
        "query": {
          "query": "label_values(kube_pod_info{namespace=\"$namespace\"}, pod)",
          "refId": "StandardVariableQuery"
        },
        "refresh": 1,
        "regex": "",
        "skipUrlSync": false,
        "sort": 0,
        "type": "query"
      },
      {
        "current": {
          "selected": false,
          "text": "",
          "value": ""
        },
        "hide": 0,
        "label": "String Match",
        "name": "search",
        "options": [
          {
            "selected": true,
            "text": "",
            "value": ""
          }
        ],
        "query": "",
        "skipUrlSync": false,
        "type": "textbox"
      }
    ]
  },
  "time": {
    "from": "now-1h",
    "to": "now"
  },
  "timepicker": {
    "hidden": false,
    "refresh_intervals": [
      "10s",
      "30s",
      "1m",
      "5m",
      "15m",
      "30m",
      "1h",
      "2h",
      "1d"
    ]
  },
  "timezone": "",
  "title": "[ Hangout ] Log - pod",
  "uid": "sadlil-loki-apps-dashboard1",
  "version": 5,
  "weekStart": ""
}
- 로그 내용 설정
- 옵션 클릭 -> edit 클릭
- 그래프 설정
- 옵션 클릭 -> edit 클릭

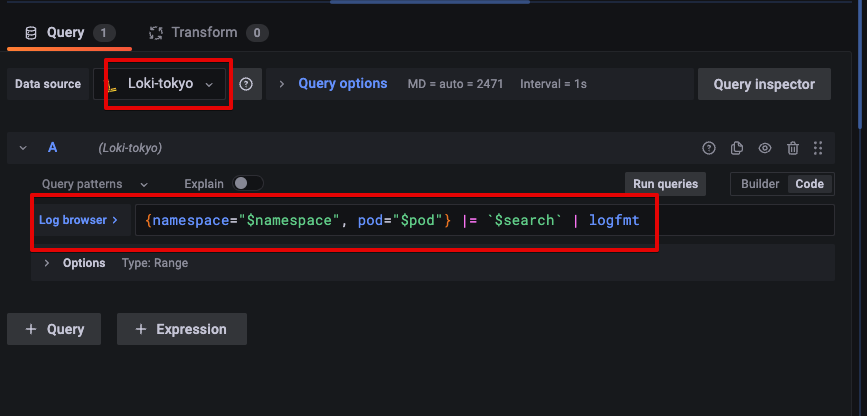
- Data source : Loki 선택
- Code : {namespace="$namespace", pod="$pod"} |= `$search` | logfmt
- save 저장
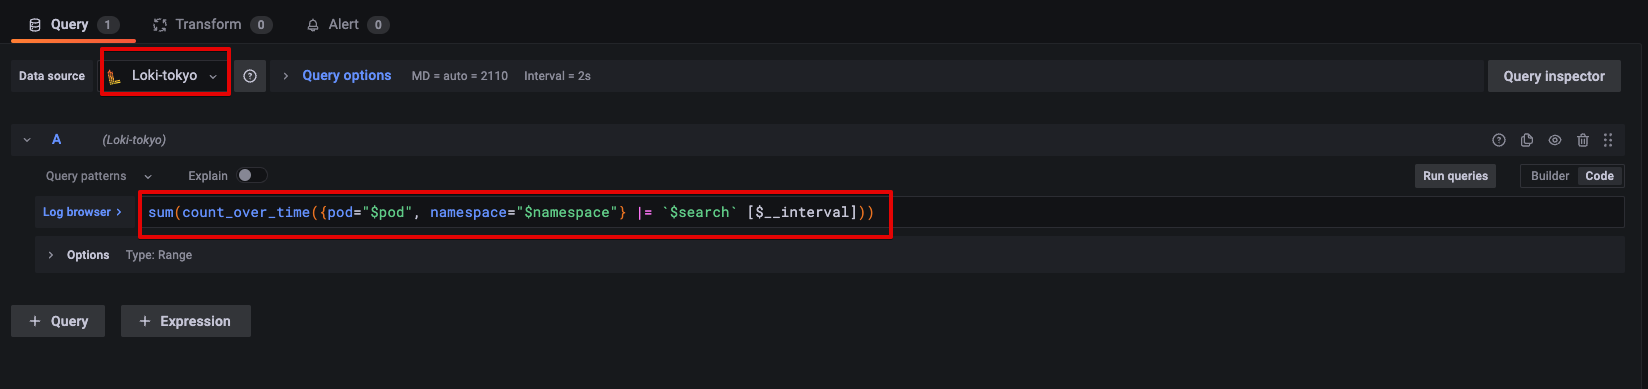
- Data source : Loki 선택
- code : sum(count_over_time({pod="$pod", namespace="$namespace"} |= `$search` [$__interval]))
6. Loki Alert 설정
- Alerting -> Alert rules -> "New alert rule" 클릭

- A : Loki 선택
- Label filters : Loki에 저장할 때 사용한 Job 이름 선택 or 다른 label도 사용가능
- Line contains regex match : 로그에서 검색할 정보 입력 (and 조건을 사용할려면 regex 옵션으로 선택)
- Count over time : 1m
- Sum by : 조건에 맞을 내용이 추출될때 원하는 Label만 보여줄때 사용 or Aler 보낼때 label 사용 가능
- 코드 내용 :
sum by(kubernetes_pod_name, kubernetes_container_name, kubernetes_namespace_name) (count_over_time({job="fluentbit-portal"} |~ `error|Error|ERROR` [1m]))
- B : Classsic_conditions

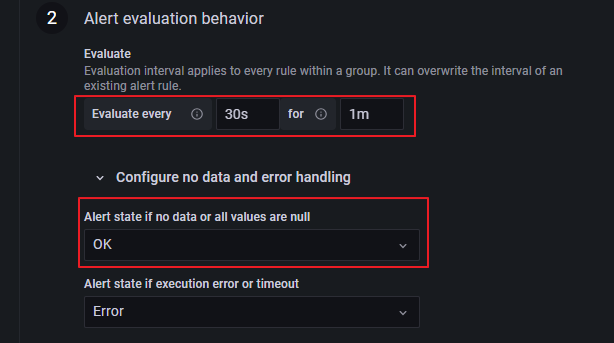
- 30s마다 조건을 실행, B 조건에 맞으면 Pending 상태로 변경
- for : B 조건이 1m 유지되면 알람 발생
- Alert state if no data or all values are null : "no data"일 경우 알람을 보내지 않는 옵션
- Rule name : rule 이름
- Folder : Dashboard 폴더 선택
- Group : rule 그룹 선택
- AlertValues : 원하는 정보 넣기
- {{ with $values }}
{{ range $k, $v := . }}
Pod: {{$v.Labels.kubernetes_pod_name}}
Container: {{$v.Labels.kubernetes_container_name}}
NameSpace: {{$v.Labels.kubernetes_namespace_name}}
Alerting value: {{ $v }}
Grafana URL : https://xxx.com/d/liz0yRCZz/xxx-namespaces-log?orgId=1&var-namespace={{$v.Labels.kubernetes_namespace_name}}&var-search=error%7CError%7CERROR&from=now-5m&to=now&var-pod={{$v.Labels.kubernetes_pod_name}}{{ end }}
{{ end }}
- {{ with $values }}

- Slack 알람 내용

'모니터링 > Loki' 카테고리의 다른 글
| [ Cloudwatch ] fluent-bit에서 CW으로 로그 적재 (0) | 2024.01.17 |
|---|---|
| fluent-bit (0) | 2023.10.18 |