반응형
개요
Prometheus Alertmanager는 Prometheus 모니터링 시스템의 알림 관리 도구입니다.
Prometheus는 감시 대상을 주기적으로 폴링하고 지표를 수집하여 저장합니다.
이러한 지표를 분석하고 규칙을 정의하여 문제가 발생하면 이를 감지하고 알림을 발생시킵니다.
이때 Alertmanager는 Prometheus가 생성한 알림을 처리하고 관리하는 역할을 합니다.
Alertmanager는 알림을 필터링하고 그룹화하여 수신 대상을 선택하고 다양한 방법으로 알림을 전송할 수 있습니다.
또한 Alertmanager는 중복 알림을 방지하고 알림 상태를 추적하여 중복 알림을 생성하지 않도록 보장합니다.
따라서 Alertmanager는 Prometheus 모니터링 시스템의 중요한 구성 요소 중 하나입니다.
AlertManager 메뉴얼 : https://prometheus.io/docs/alerting/latest/alertmanager/
특이사항 : Grafana Alert보다 AlertManager Alert이 기능이 더 많기 때문에 Alertmanager 를 사용함
알람 프로세스
- Prometheus에서 수집된 정보를 가지고 해당 조건에 맞으면 알람을 발생(Firing) 시킨다.
- Prometheus에서 발생한 알람을 → Alertmanager에 전달한다.
- AlertManager은 설정된 Slack으로 알람 메세지를 전달해준다.
Slack APP 설정
1. Slack APP 셋팅 접속
2. Slack APP 생성
- “Create New App” 클릭

- “From scratch” 클릭

- App Name: 입력
- Pick a workspace 선택
- “Create APP” 클릭

- 새로 생성한 “Prometheus-alert” 앱 클릭
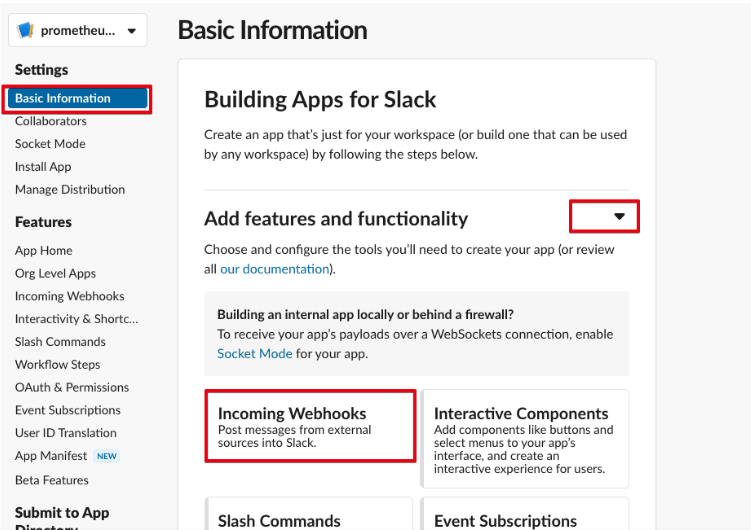
- “Basic information” 클릭
- “Add features and functionality” 클릭
- “Incoming Webhooks” 클릭
- Activate Incoming Webhooks” : ON 클릭

- “Add New Webhook to Workspace” 클릭

- “Prometheus-Alert” 앱과 연동할 채널 설정
- ex) datadog-misc-infra 채널에 설정

- webhook 주소가 생김

- webhook URL 주소
https://hooks.slack.com/services/xxx/xxx/xxx
- slack 채널에 webhook 테스트
curl -X POST -H 'Content-type: application/json' --data '{"text":"Hello, World!"}' https://hooks.slack.com/services/xxx/xxx/xxx

Prometheus - Slack 알람 설정
1. Alertmanager에서 slack 설정
vi values.yaml

alertmanager:
  config:
    global:
      resolve_timeout: 5m
    inhibit_rules:
      - source_matchers:
          - 'severity = critical'
        target_matchers:
          - 'severity =~ warning|info'
        equal:
          - 'namespace'
          - 'alertname'
      - source_matchers:
          - 'severity = warning'
        target_matchers:
          - 'severity = info'
        equal:
          - 'namespace'
          - 'alertname'
      - source_matchers:
          - 'alertname = InfoInhibitor'
        target_matchers:
          - 'severity = info'
        equal:
          - 'namespace'
    route:
      group_by: ['namespace','alertname']
      group_wait: 30s
      group_interval: 2m
      repeat_interval: 12h
      receiver: 'prod-infra'
      routes:
      - receiver: 'prod-infra'
        group_wait: 10s
    receivers:
    - name: 'prod-infra'
      slack_configs:
      - channel: 'test-service-prod-infra'
        api_url: "https://hooks.slack.com/services/xxx/xxx/xxx"
        send_resolved: true
        title: |-
          [{{ .Status | toUpper }}{{ if eq .Status "firing" }}:{{ .Alerts.Firing | len }}{{ end }}] {{ .CommonLabels.alertname }}
        text: |-
          {{ range .Alerts }}
          *Alert : * {{ .Annotations.title }}{{ if .Labels.severity }} - `{{ .Labels.severity }}`
          *summary : * {{ .Annotations.summary }}
          *Description : * {{ .Annotations.description }}
          *Details : *
            {{ range .Labels.SortedPairs }} • *{{ .Name }} : * `{{ .Value }}`
            {{ end }}


          *Grafana URL : * https://grafana.test.com{{ end }}
          {{ end }}
    templates:
    - '/etc/alertmanager/config/*.tmpl'
- 옵션 정보
| resolve_timeout: 5m | 해결(resolve) 알람이 오지 않을 경우, 알람 경고가 자동으로 해결(resolve) 될지 설정 |
| inhibit_rules: - source_matchers: - 'severity = critical' target_matchers: - 'severity =~ warning|info' equal: - ‘namespace’ - ‘alertname’ |
비슷한 설정의 알람이 여러 개가 동시에 firing 되며, 비슷한 알람들중에서 Alert 1개만 울리도록 한다. ex) cpu 80% warning, cpu 90% critical rule이 존재할 때, cpu 91%프로가 되면 warning, critical 알람이 동시에 울리는 것이 아니라 규칙으로 정의한 critical 알람만 받도록 한다. equal은 namespace, alertname 라벨이 동일한 Alert 규칙이 적용된다. |
| route: group_by: ['namespace'] |
경고를 레이블로 그룹화 |
| route: group_interval: 30s |
동일한 group Alert이 발생했을 경우 몇 분있다가 알람을 보낼지 설정 |
| route: group_wait: 30s |
alert 버퍼를 몇초 동안 유지할지 설정 |
| route: repeat_interval: 12h |
경고에 대한 알람이 이미 전송된 경우 알람을 다시 보내기 전에 대기할 시간 |
| route: receiver: ‘test-monitoring’ |
|
| route: routes: - receiver: ‘test-monitoring’ |
|
| receivers: slack_configs: channel: api_url: send_resolved: title: text: |
channel : 알람을 보낼 Slack의 ‘채널 방' or '개인 사용자’ api_rul : Slack webhook URL 주소 send_resolved : Alert이 해결되면 Resolved 알람 여부 설정 title : 알람의 제목 부분 text : 알람의 텍스트 부문 |
inhibit_rules 설정하는 이유
여러개의 Alert(알람)이 존재할 경우, 집합과 일치하는 경고는 음소거합니다.
ex) network 장애가 발생하면 EKS, WokerNoe, pod 등이 Alert 발생하면서 몇백개~몇천개의 알람이 발생합니다.
이럴 때 몇천개의 알람을 받는게 아니라 특정 조건의 알람만 전달 받을 수 있도록 설정 할 수 있습니다.
ex) warnning, critical 알람이 모두 발생하면 warnning 알람을 제외한 critical 알람만 받을 수 있게 할 수 있습니다.
ex) workernode 장애가 생기면, workernode down 알람만 받고 pod관련된 알람은 제외 시킬 수 있습니다.
inhibit_rule 메뉴얼 : https://prometheus.io/docs/alerting/latest/configuration/#inhibit_rule
route 옵션을 설정하는 이유
- AlertManager가 여러개의 알람을 받아서 바로 전달하는 것이 아니라, group를 단위로 모아서 한번꺼번에 같이 전달합니다.
- 알람을 전달받았지만, 에러가 해결되지 않는 알람을 계속 받는 것이 아니라, 특정 시간만큼 제외 시켰다가 다시 전달해줍니다.
반응형
'모니터링 > prometheus' 카테고리의 다른 글
| [ Loki ] 설치 (0) | 2023.06.24 |
|---|---|
| [ Prometheus ] Alert - Rule (0) | 2023.03.16 |
| [ Prometheus ] exporter 종류 (0) | 2023.03.16 |
| [ Prometheus ] Nginx Log exporter (0) | 2023.03.16 |
| [ prometheus ] Nginx exporter (0) | 2023.03.16 |