반응형

분류 전체보기 103

[ Fargate ] Adot-collector 설치 (fargate 메트릭,로그)

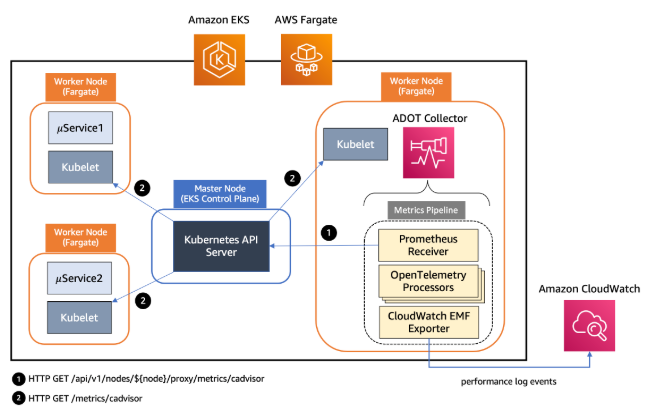
개요EKS WokerNode를 EC2방식과 Fargate 방식으로 띄울 수 있습니다.Fargate 방식으로 WorkerNode를 띄울 경우 daemonset pod를 배포할 수 가 없습니다.daemonset pod를 배포하지 못하면 일어나는 일- prometheus에서 데이터 수집용인 node-exporter를 배포할 수 가 없습니다.- 로그 수집 fluent-bit를 배포할 수 가 없습니다.- 등AWS EKS의 Fargate에서 실행되는 어플리케이션의 경우 ADOT(AWS Distro for OpenTelemetry)으로 시스템 지표(메트릭), Log를 수집메트릭은 CloudWatch Container Insights에 저장되며, CloudWatch 컨테이너 인사이트 대시보드으로 확인 가능  OpenT..

[ ArgoCD ] Application syncOptions

ArgoCD Application에서 배포할때 다양한 옵션을 적용할 수 있습니다.배포 시 레이블 추가배포 시 Namespace 추가배포 시 해당 옵션 무시 등등 참조 링크 : https://argo-cd.readthedocs.io/en/stable/user-guide/sync-options/#respect-ignore-difference-configs     Deployment에서 replicas 옵션을 무시PersistentVolume에서 nodeAffinity 옵션을 무시apiVersion: argoproj.io/v1alpha1kind: Applicationspec: ignoreDifferences: - group: "apps" kind: "Deployment" jsonPointers:..

[ Cloudwatch ] fluent-bit에서 CW으로 로그 적재

개요 kubernetes pod의 로그를 수집하기 위해서 fluent-bit을 사용할 수 있습니다. (그외 다른 것도 있습니다.) 로그 수집 흐름 example 1) fluent-bit -> Loki -> Grafana example 2) fluent-bit -> CloudWatch -> Grafana example 3) fluent-bit -> ElasticSearch -> Grafana > 로그 저장소를 원하는 것으로 선택하시면 됩니다. 참조 링크 1. fluent-bit 커스텀 설치 : https://dongwook35.tistory.com/93 2. AWS CloudWatch 로그 수집 공식 메뉴얼 : https://docs.aws.amazon.com/ko_kr/AmazonCloudWatch/la..

[ GitHub ] Action

GitHub Action으로 CI/CD를 구성할 수 있습니다. GitHub-hosted-runner는 GitHub 자원을 사용하며, 한달에 스토리지 : 500MB, 시간 : 2000분을 무료 제공 Self-hosted-runner는 개인 노트북,서버 자원을 사용하여 CI/CD 진행 1. GitHub Action 사용방법 메뉴얼 : https://docs.github.com/ko/actions/using-workflows/events-that-trigger-workflows # 사용할 이름을 지정 name: test # 해당 Action은 아래의 조건을 만족할 때 실행됨 on: push: branches: [ main ] # main 브랜치에 push가 발생할 때 pull_request: branches:..

[ Fargate ] Fargate 로깅

개요 EKS WokerNode를 EC2방식과 Fargate 방식으로 띄울 수 있습니다. Fargate 방식으로 WorkerNode를 띄울 경우 daemonset pod를 배포할 수 가 없습니다. daemonset pod를 배포하지 못하면 일어나는 일 - prometheus에서 데이터 수집용인 node-exporter를 배포할 수 가 없습니다. - 로그 수집 fluent-bit를 배포할 수 가 없습니다. - 등 1. Fargate에서 로깅하는 방법 메뉴얼 : https://docs.aws.amazon.com/ko_kr/eks/latest/userguide/fargate-logging.html Fargate 용 fluent-bit 설치해서 로그를 수집할 수 있습니다. fluent-bit container를 ..

fluent-bit

kubernetes pod의 로그를 수집하기 위해서 Loki와 fluent-bit을 사용할 수 있습니다. (그외 다른 것도 있습니다.) fluent-bit -> Loki -> Grafana 1. fluent-bit 이란 ? fluent-bit은 로그 수집기(LogStash, fluentd 등) 입니다. fluent-bit 메뉴얼 : https://docs.fluentbit.io/manual/about/what-is-fluent-bit 2. Data pipeline data pipeline 링크 : https://docs.fluentbit.io/manual/concepts/data-pipeline/input Input plugin 링크 : https://docs.fluentbit.io/manual/pipe..

[ ingress ] annotations 옵션

개요 ingress을 이용해서 AWS ALB를 생성할 수 있습니다. ingress를 배포하면 ALB Controller가 감지해서 AWS에 ALB 리소스를 생성해줍니다. 특이사항 SecurityGroup 원복(초기화)되는 현상 - ALB SecurityGroup를 AWS Console에서 수정하면 ALB Controller가 변경된 내용을 감지해서 다시 원복합니다. - 원복을 방지하기 위해서는 아래와 같은 2가지 방식을 선택할 수 있습니다. 1. alb.ingress.kubernetes.io/inbound-cidrs ALB 생성하면 SecurityGroup이 자동으로 생성됩니다. 자동으로 생성되는 SecurityGroup에 Inbound Rule옵션을 아래와 같은 옵션으로 넣을 수 있습니다. ex) al..

카테고리 없음 2023.10.17

[ AMP ] Amazon Managed service for Prometheus 구축

개요 amp은 프로메테우스 모니터링 서비스입니다. 장점 - 프로메테우스 서버(pod)를 이중화 하지 않아도 됩니다. - 사용하는 만큼 비용을 지불하기 때문에 볼륨(PV, EFS) 설정을 하지 않아도됩니다. - pod를 관리할 필요없으며, 확장성, 가용성 및 보안을 누릴 수 있습니다. 단점 : - prometheus Dashboard가 없어서 사용하기 불편합니다. - awscurl으로 query URL으로 메트릭 정보 및 알람 정보를 봐야합니다. - AlertManager Dashboard가 없어서 사용하기 불편합니다. - Rule Management를 yaml형태로 업로드해서 사용해야합니다. - Alert Manager에 yaml형태로 업로드해서 사용해야합니다. - Alert은 SNS만 지원됩니다. - ..

[ prometheus ] scrape 설정

개요 prometheus server가 exporter 메트릭을 수집(scrape) 갑니다. exporter 메트릭을 수집(scrape)하기 위해서는 "ScrapeConfigs" 설정에서 job_name 별로 설정해야합니다. https://prometheus.io/docs/prometheus/latest/configuration/configuration/#kubernetes_sd_config 1. Scrape 옵션 설명 job_name : 수집한 데이터를 구분하기 위한 이름입니다. scrape_interval : 수집할 간격 metrics_path : URL Path static_configs : 지정한 Target IP만 데이터를 수집합니다. kubernetes_sd_configs : SD(Servic..

[ prometheus ] blackbox exporter

개요 BlackBox exporter를 이용하여 외부에 있는 엔드포인트 서비스를 모니터링 할 수 있습니다. HTTPS, HTTP, TCP, DNS, ICMP 등 외부 엔드포인트 probe(조사) 할 수 있습니다. 엔드포인트 모니터링은 HTTP 대기 시간 DNS 조회 대기 시간 SSL 인증서 만료 정보 TLS 버전 HTTP Version 접속 정보 (status 200, 4xx 등) 링크 https://github.com/prometheus/blackbox_exporter https://www.infracloud.io/blogs/monitoring-endpoints-kubernetes-blackbox-exporter/ 1. whitebox와 blackbox 모니터링 차이점 whitebox 모니터링 어플리케..

반응형